
- You are here:
- Home
- Data Descriptors
Data Descriptor
Data descriptor citation:
Heir Stamm, J., Serban, N., Swann, J. "Accessibility and Availability of Vaccine in the 2009 H1N1 Vaccination Campaign", published by the Health Analytics Group@GT.
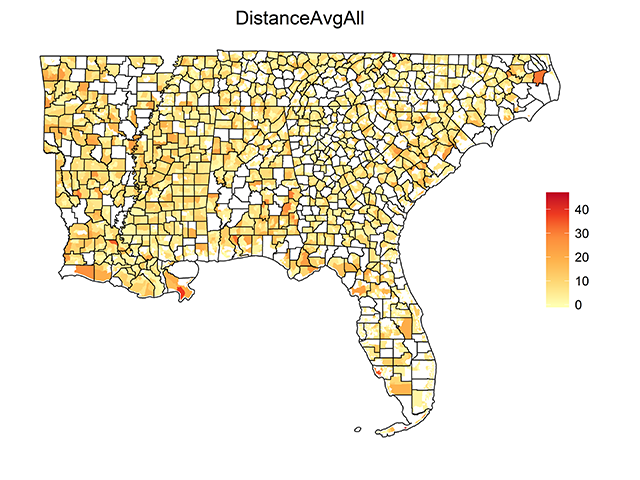
This data descriptor presents small-area estimates of spatial access to H1N1 vaccine derived using optimization modeling with individual choice constraints, for the states of Alabama, Arkansas, Florida, Georgia, Louisiana, Mississippi, North Carolina, South Carolina, and Tennessee. Estimates are included for both the overall population and for the sub-population of children and young adults (ages six months to 24 years). The latter constituted an important priority group in the H1N1 vaccination campaign. Spatial access measures considered are Proximity and Scarcity.
Proximity pertains to the distance barriers that patients experience in reaching their providers, measured as travel distance. Scarcity pertains to the number of people seeking vaccine at a facility relative to the number of vaccine doses available there.
These estimates can be used to identify locations for targeted improvements in spatial access to H1N1 vaccine and to quantify local disparities in access.
The data file attached with this descriptor includes the following columns:
ST_FIPS – Two-digit FIPS (Federal Information Processing Standard) state code
CO_FIPS – Three-digit FIPS (Federal Information Processing Standard) county code
TRACT – Six-digit census tract code
Y – latitude
X – longitude
ServiceAvgAll – Average scarcity (persons per vaccine) experienced by all individuals in the corresponding census tract
DistanceAvgAll – Average distance (miles) traveled by all individuals in the corresponding census tract to receive vaccine
ServiceAvgPriority – Average scarcity (persons per vaccine) experienced by the sub-population of children and young adults ages six months to 24 years in the corresponding census tract when vaccine is available only to the sub-population
DistanceAvgPriority – Average distance (miles) traveled by the sub-population of children and young adults ages six months to 24 years in the corresponding census tract when vaccine is available only to the sub-population
Taxonomy
- Estimates
- Access
Data Descriptor
Data descriptor citation:
Gentili, M., Serban, N., Swann, J. "Accessibility and Availability of Pediatric Primary Care: Louisiana", published by the Health Analytics Group@GT.
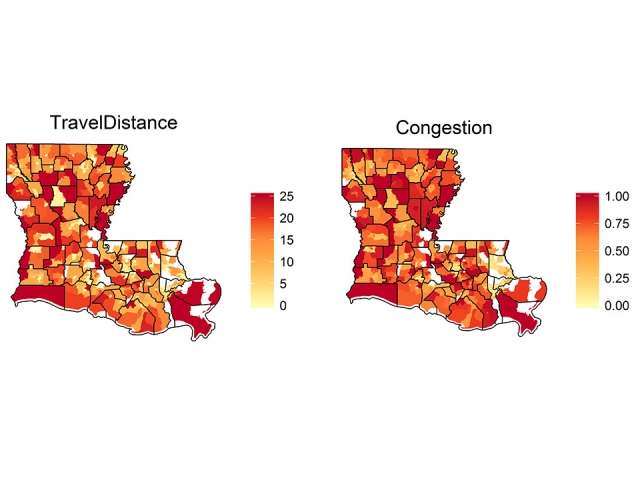
This data descriptor presents small-area estimates for spatial access estimates derived using optimization modeling with access constraints, for the state of Louisiana and for year 2013. Estimates are included for both the overall children population (that is, Medicaid-insured, privately-insured and uninsured populations combined) and for the Medicaid-insured population alone. Spatial access measures considered are Accessibility and Availability.
Accessibility pertains to the distance barriers that patients experience in reaching their providers, measured as travel distance. Availability pertains to the providers’ patient volume or time available for healthcare delivery that patients experience when seeking care, measured as congestion experienced at in the provider's office.We also provide the percentage of children who have access, defined here as coverage. The estimates are differentiated for public-insured and private-insured children because of the differences in acceptability of these two insurance types. These estimates can be used to identify locations where to target improvements in spatial access to pediatric primary care and to quantify disparities between public-insured and private-insured children. Similar estimates are also provided for other states available as separate data descriptors, allowing for comparisons between states.
The data file attached with this descriptor includes the following columns:
GEOID10 - The identification number of the census tract
X & Y - latitude and longitude
Coverage - The percentage of children who are matched with a provider (i.e. they have access)
CoverageMED - The percentage of public-insured children who are matched with a provider accepting public insurance
CoveragOTH - The percentage of private-insured children who are matched with a provider
TravelDistance - The average travel distance a child travels to reach his/her primary care provider
TravelDistanceMED - The average travel distance a public-insured child travels to reach his/her primary care provider accepting public insurance
TravelDistanceOTH - The average travel distance a privately-insured child travels to reach his/her primary care provider
Congestion - The ratio between met need to providers' caseload
CongestionMED - The ratio between met need for public-insured children to providers' Medicaid caseload
CongestionOTH - The ratio between met need for privately-insured children to providers' non-Medicaid caseload
Taxonomy
- Estimates
- Access
References
Gentili, M., Serban, N., O'Connor, J., Swann, J. (2015+) "Quantifying Disparities in Accessibility and Availability of Pediatric Primary Care with Implications for Policy", under revisions.
 ,
,  ,
, 
Data Descriptor
Data descriptor citation:
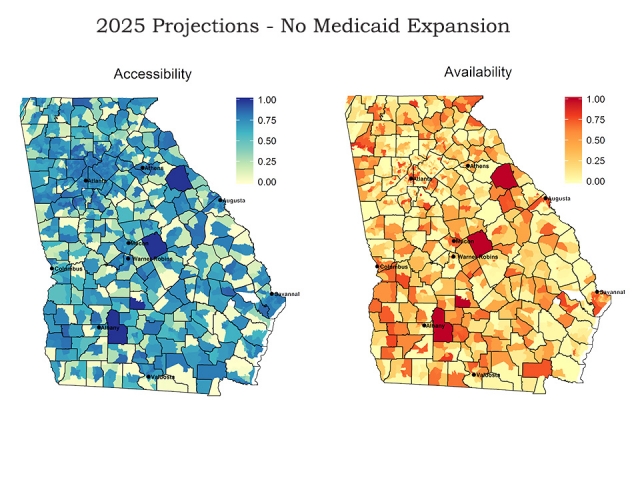
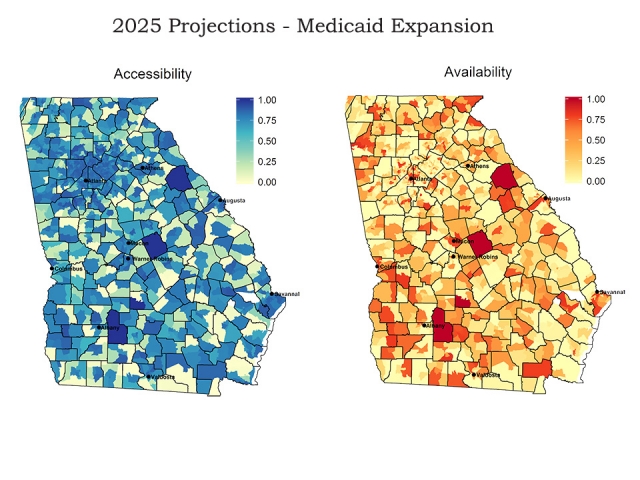
Harati, P., Gentili, M., Serban, N. "2025 Projections for Accessibility and Availability of Adult Primary Care: Georgia", published by the Health Analytics Group @ GT.
This data descriptor provides spatial access projections for 2025, using a 2013 base year, for adult primary care in Georgia at the census tract level. Adult primary care consists of visits to general practice, family medicine, and internal medicine physicians, nurse practitioners, and physician assistants by the population aged 19-64. We assume the Affordable Care Act was implemented in Georgia without and with the Medicaid expansion option. Data is included for both the overall population (that is, Medicaid-insured, privately-insured and uninsured populations combined) and for the Medicaid-insured population alone.
Accessibility is a measure between 0 and 1 reflecting the distance barriers patients face to reach their providers. It is calculated as one minus the ratio between the average distance a person travels to reach his/her assigned provider and the maximum allowed distance according to the guidelines established by the U.S. Department of Health and Human Services. Higher values mean on average, patients living in that geographic area do not have to travel as far to access care.
Availability is a measure between 0 and 1 reflecting the opportunity patients have to choose among different providers. It is calculated as one minus the congestion (the ratio between assigned visits to a provider and his/her maximum caseload) a person experiences for each visit at his/her assigned provider. Higher values mean on average, patients living in that geographic area visit providers who have more excess capacity.
Coverage is a measure between 0 and 1 reflecting patients’ ability to find providers to serve them. Specifically, it equals the proportion of adults in a geographic area who were matched with a provider.
Also included in the file is the estimated number of visits needed and the estimated number of visits served. The number of visits needed depends on the age, gender, and insurance status of the population. The number of visits served is the number of visits needed that providers are able to see, which is based on the projected on residing in that geographic area.
The two files included with this data descriptor are:
apc_2025_nonexpansion.csv - The projection data without the Medicaid expansion option
apc_2025_expansion.csv - The projection data with the Medicaid expansion option
The data file attached with this descriptor includes the following columns:
GEOID10 - The identification number of the census tract
X & Y - latitude and longitude
Accessibility: Accessibility for the overall population living in that census tract
AccessibilityMED: Accessibility for the Medicaid-insured population living in that census tract
Availability: Availability for the overall population living in that census tract
AvailabilityMED: Availability for the Medicaid-insured population living in that census tract
Coverage: Coverage for the overall population living in that census tract
CoverageMED: Coverage for the Medicaid-insured population living in that census tract
VisitsNeeded: The number of visits needed by the overall population living in that census tract
VisitsServed: The number of visits needed by the overall population living in that census tract that are able to be served by the available supply
VisitsNeededMED: The number of visits needed by the Medicaid-insured population living in that census tract
VisitsServedMED: The number of visits needed by the Medicaid-insured population living in that census tract that are able to be served by the available supply
Taxonomy
- Projections
- Access
References
Harati, P., Gentili, M., Serban, N. (2015+) "Projecting the Impact of the A ordable Care Act Provisions on Accessibility and Availability of Primary Care for the Adult Population in Georgia", under review.
Data Descriptor
Data descriptor citation:
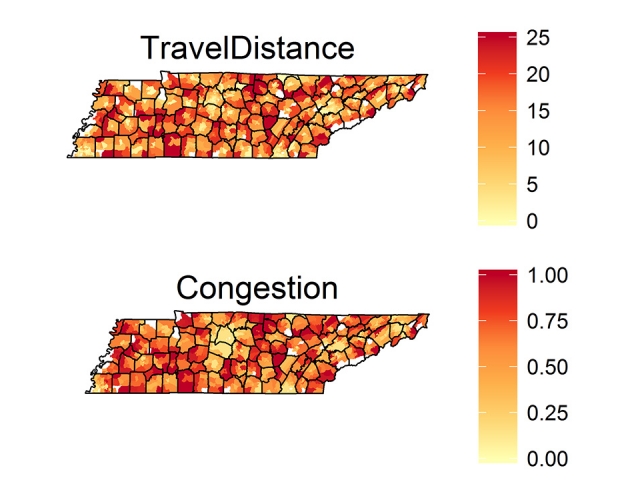
Gentili, M., Serban, N., Swann, J. "Accessibility and Availability of Pediatric Primary Care: Tennessee", published by the Health Analytics Group@GT.
This data descriptor presents small-area estimates for spatial access estimates derived using optimization modeling with access constraints, for the state of Tennessee and for year 2013. Estimates are included for both the overall children population (that is, Medicaid-insured, privately-insured and uninsured populations combined) and for the Medicaid-insured population alone. Spatial access measures considered are Accessibility and Availability.
Accessibility pertains to the distance barriers that patients experience in reaching their providers, measured as travel distance. Availability pertains to the providers’ patient volume or time available for healthcare delivery that patients experience when seeking care, measured as congestion experienced at in the provider's office.We also provide the percentage of children who have access, defined here as coverage. The estimates are differentiated for public-insured and private-insured children because of the differences in acceptability of these two insurance types. These estimates can be used to identify locations where to target improvements in spatial access to pediatric primary care and to quantify disparities between public-insured and private-insured children. Similar estimates are also provided for other states available as separate data descriptors, allowing for comparisons between states.
The data file attached with this descriptor includes the following columns:
GEOID10 - The identification number of the census tract
X & Y - latitude and longitude
Coverage - The percentage of children who are matched with a provider (i.e. they have access)
CoverageMED - The percentage of public-insured children who are matched with a provider accepting public insurance
CoveragOTH - The percentage of private-insured children who are matched with a provider
TravelDistance - The average travel distance a child travels to reach his/her primary care provider
TravelDistanceMED - The average travel distance a public-insured child travels to reach his/her primary care provider accepting public insurance
TravelDistanceOTH - The average travel distance a privately-insured child travels to reach his/her primary care provider
Congestion - The ratio between met need to providers' caseload
CongestionMED - The ratio between met need for public-insured children to providers' Medicaid caseload
CongestionOTH - The ratio between met need for privately-insured children to providers' non-Medicaid caseload
Taxonomy
- Estimates
- Access
References
Gentili, M., Serban, N., O'Connor, J., Swann, J. (2015+) "Quantifying Disparities in Accessibility and Availability of Pediatric Primary Care with Implications for Policy", under revisions.
Data Descriptor
Data descriptor citation:
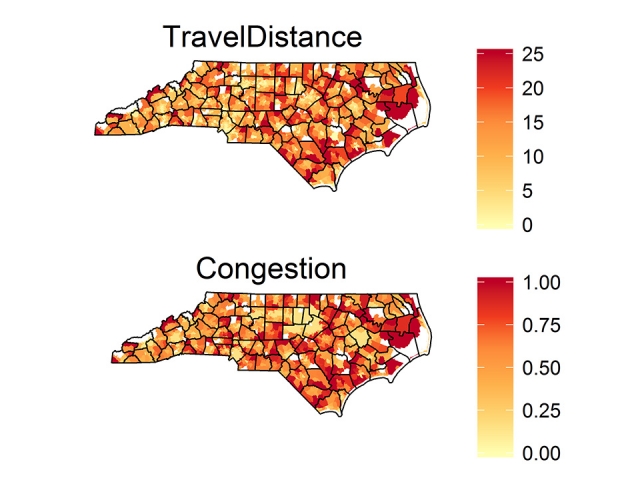
Gentili, M., Serban, N., Swann, J. "Accessibility and Availability of Pediatric Primary Care: North Carolina", published by the Health Analytics Group@GT.
This data descriptor presents small-area estimates for spatial access estimates derived using optimization modeling with access constraints, for the state of North Carolina and for year 2013. Estimates are included for both the overall children population (that is, Medicaid-insured, privately-insured and uninsured populations combined) and for the Medicaid-insured population alone. Spatial access measures considered are Accessibility and Availability.
Accessibility pertains to the distance barriers that patients experience in reaching their providers, measured as travel distance. Availability pertains to the providers’ patient volume or time available for healthcare delivery that patients experience when seeking care, measured as congestion experienced at in the provider's office.We also provide the percentage of children who have access, defined here as coverage. The estimates are differentiated for public-insured and private-insured children because of the differences in acceptability of these two insurance types. These estimates can be used to identify locations where to target improvements in spatial access to pediatric primary care and to quantify disparities between public-insured and private-insured children. Similar estimates are also provided for other states available as separate data descriptors, allowing for comparisons between states.
The data file attached with this descriptor includes the following columns:
GEOID10 - The identification number of the census tract
X & Y - latitude and longitude
Coverage - The percentage of children who are matched with a provider (i.e. they have access)
CoverageMED - The percentage of public-insured children who are matched with a provider accepting public insurance
CoveragOTH - The percentage of private-insured children who are matched with a provider
TravelDistance - The average travel distance a child travels to reach his/her primary care provider
TravelDistanceMED - The average travel distance a public-insured child travels to reach his/her primary care provider accepting public insurance
TravelDistanceOTH - The average travel distance a privately-insured child travels to reach his/her primary care provider
Congestion - The ratio between met need to providers' caseload
CongestionMED - The ratio between met need for public-insured children to providers' Medicaid caseload
CongestionOTH - The ratio between met need for privately-insured children to providers' non-Medicaid caseload
Taxonomy
- Estimates
- Access
References
Gentili, M., Serban, N., O'Connor, J., Swann, J. (2015+) "Quantifying Disparities in Accessibility and Availability of Pediatric Primary Care with Implications for Policy", under revisions.
Data Descriptor
Data descriptor citation:
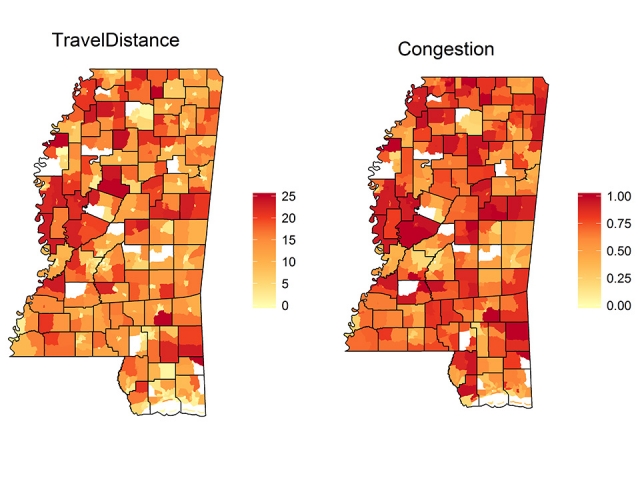
Gentili, M., Serban, N., Swann, J. "Accessibility and Availability of Pediatric Primary Care: Mississippi", published by the Health Analytics Group@GT.
This data descriptor presents small-area estimates for spatial access estimates derived using optimization modeling with access constraints, for the state of Mississippi and for year 2013. Estimates are included for both the overall children population (that is, Medicaid-insured, privately-insured and uninsured populations combined) and for the Medicaid-insured population alone. Spatial access measures considered are Accessibility and Availability.
Accessibility pertains to the distance barriers that patients experience in reaching their providers, measured as travel distance. Availability pertains to the providers’ patient volume or time available for healthcare delivery that patients experience when seeking care, measured as congestion experienced at in the provider's office.We also provide the percentage of children who have access, defined here as coverage. The estimates are differentiated for public-insured and private-insured children because of the differences in acceptability of these two insurance types. These estimates can be used to identify locations where to target improvements in spatial access to pediatric primary care and to quantify disparities between public-insured and private-insured children. Similar estimates are also provided for other states available as separate data descriptors, allowing for comparisons between states.
The data file attached with this descriptor includes the following columns:
GEOID10 - The identification number of the census tract
X & Y - latitude and longitude
Coverage - The percentage of children who are matched with a provider (i.e. they have access)
CoverageMED - The percentage of public-insured children who are matched with a provider accepting public insurance
CoveragOTH - The percentage of private-insured children who are matched with a provider
TravelDistance - The average travel distance a child travels to reach his/her primary care provider
TravelDistanceMED - The average travel distance a public-insured child travels to reach his/her primary care provider accepting public insurance
TravelDistanceOTH - The average travel distance a privately-insured child travels to reach his/her primary care provider
Congestion - The ratio between met need to providers' caseload
CongestionMED - The ratio between met need for public-insured children to providers' Medicaid caseload
CongestionOTH - The ratio between met need for privately-insured children to providers' non-Medicaid caseload
Taxonomy
- Estimates
- Access
References
Gentili, M., Serban, N., O'Connor, J., Swann, J. (2015+) "Quantifying Disparities in Accessibility and Availability of Pediatric Primary Care with Implications for Policy", under revisions.
Data Descriptor
Data descriptor citation:
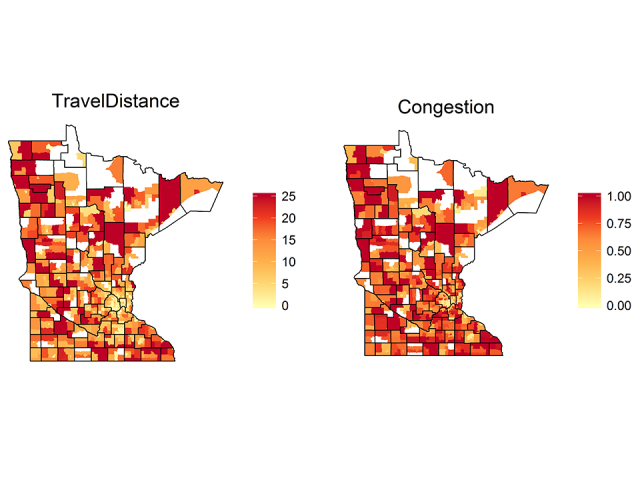
Gentili, M., Serban, N., Swann, J. "Accessibility and Availability of Pediatric Primary Care: Minnesota", published by the Health Analytics Group@GT.
This data descriptor presents small-area estimates for spatial access estimates derived using optimization modeling with access constraints, for the state of Minnesota and for year 2013. Estimates are included for both the overall children population (that is, Medicaid-insured, privately-insured and uninsured populations combined) and for the Medicaid-insured population alone. Spatial access measures considered are Accessibility and Availability.
Accessibility pertains to the distance barriers that patients experience in reaching their providers, measured as travel distance. Availability pertains to the providers’ patient volume or time available for healthcare delivery that patients experience when seeking care, measured as congestion experienced at in the provider's office.We also provide the percentage of children who have access, defined here as coverage. The estimates are differentiated for public-insured and private-insured children because of the differences in acceptability of these two insurance types. These estimates can be used to identify locations where to target improvements in spatial access to pediatric primary care and to quantify disparities between public-insured and private-insured children. Similar estimates are also provided for other states available as separate data descriptors, allowing for comparisons between states.
The data file attached with this descriptor includes the following columns:
GEOID10 - The identification number of the census tract
X & Y - latitude and longitude
Coverage - The percentage of children who are matched with a provider (i.e. they have access)
CoverageMED - The percentage of public-insured children who are matched with a provider accepting public insurance
CoveragOTH - The percentage of private-insured children who are matched with a provider
TravelDistance - The average travel distance a child travels to reach his/her primary care provider
TravelDistanceMED - The average travel distance a public-insured child travels to reach his/her primary care provider accepting public insurance
TravelDistanceOTH - The average travel distance a privately-insured child travels to reach his/her primary care provider
Congestion - The ratio between met need to providers' caseload
CongestionMED - The ratio between met need for public-insured children to providers' Medicaid caseload
CongestionOTH - The ratio between met need for privately-insured children to providers' non-Medicaid caseload
Taxonomy
- Estimates
- Access
References
Gentili, M., Serban, N., O'Connor, J., Swann, J. (2015+) "Quantifying Disparities in Accessibility and Availability of Pediatric Primary Care with Implications for Policy", under revisions.

Data Descriptor
Data descriptor citation:
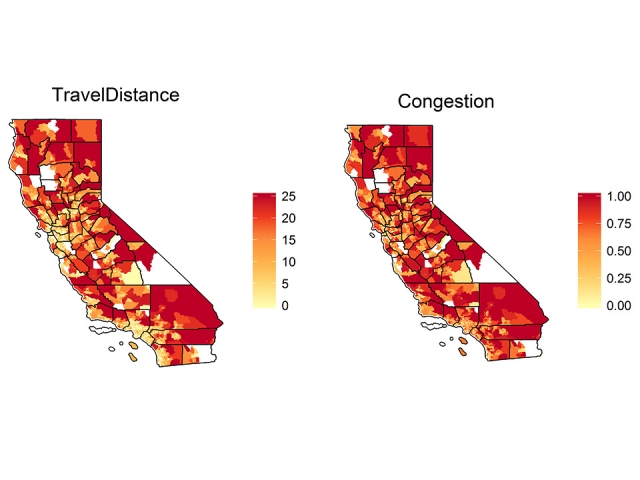
Gentili, M., Serban, N., Swann, J. "Accessibility and Availability of Pediatric Primary Care: California", published by the Health Analytics Group@GT.
This data descriptor presents small-area estimates for spatial access estimates derived using optimization modeling with access constraints, for the state of Georgia and for year 2013. Estimates are included for both the overall children population (that is, Medicaid-insured, privately-insured and uninsured populations combined) and for the Medicaid-insured population alone. Spatial access measures considered are Accessibility and Availability.
Accessibility pertains to the distance barriers that patients experience in reaching their providers, measured as travel distance. Availability pertains to the providers’ patient volume or time available for healthcare delivery that patients experience when seeking care, measured as congestion experienced at in the provider's office.We also provide the percentage of children who have access, defined here as coverage. The estimates are differentiated for public-insured and private-insured children because of the differences in acceptability of these two insurance types. These estimates can be used to identify locations where to target improvements in spatial access to pediatric primary care and to quantify disparities between public-insured and private-insured children. Similar estimates are also provided for other states available as separate data descriptors, allowing for comparisons between states.
The data file attached with this descriptor includes the following columns:
GEOID10 - The identification number of the census tract
X & Y - latitude and longitude
Coverage - The percentage of children who are matched with a provider (i.e. they have access)
CoverageMED - The percentage of public-insured children who are matched with a provider accepting public insurance
CoveragOTH - The percentage of private-insured children who are matched with a provider
TravelDistance - The average travel distance a child travels to reach his/her primary care provider
TravelDistanceMED - The average travel distance a public-insured child travels to reach his/her primary care provider accepting public insurance
TravelDistanceOTH - The average travel distance a privately-insured child travels to reach his/her primary care provider
Congestion - The ratio between met need to providers' caseload
CongestionMED - The ratio between met need for public-insured children to providers' Medicaid caseload
CongestionOTH - The ratio between met need for privately-insured children to providers' non-Medicaid caseload
Taxonomy
- Estimates
- Access
References
Gentili, M., Isett, K., Serban, N., Swann, J. (2015) "Small-Area Estimation of Spatial Access to Pediatric Primary Care and Its Implications for Policy", Journal of Urban Health, 92(5):864-909.
Gentili, M., Serban, N., O'Connor, J., Swann, J. (2015+) "Quantifying Disparities in Accessibility and Availability of Pediatric Primary Care with Implications for Policy", under revisions.

Data Descriptor
Data descriptor citation:
Harati, P., Gentili, M., Serban, N. "Accessibility and Availability of Adult Primary Care: Georgia", published by the Health Analytics Group @ GT.
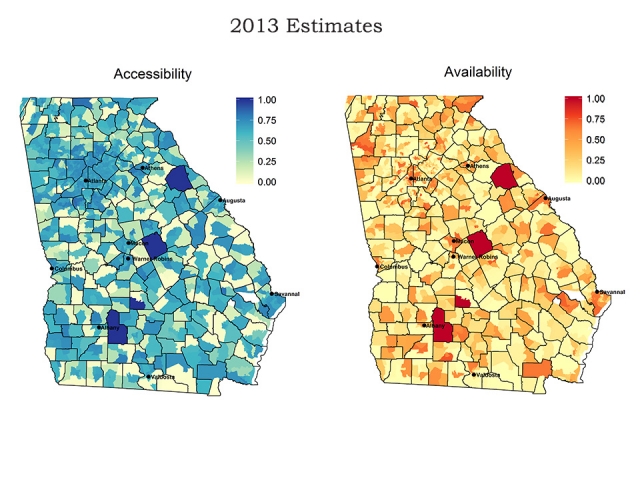
This data descriptor provides spatial access estimates for adult primary care in the state of Georgia in 2013 at the census tract level. Adult primary care consists of visits to general practice, family medicine, and internal medicine physicians, nurse practitioners, and physician assistants by the population age 19-64. Estimates are included for both the overall adult population (that is, Medicaid-insured, privately-insured and uninsured populations combined) and for the Medicaid-insured population alone. Spatial access measures considered are Accessibility, Availability, and Coverage.
Accessibility is a measure between 0 and 1 reflecting the distance barriers patients face to reach their providers. It is calculated as one minus the ratio between the average distance a person travels to reach his/her assigned provider and the maximum allowed distance according to the guidelines established by the U.S. Department of Health and Human Services. Higher values mean on average, patients living in that geographic area do not have to travel as far to access care.
Availability is a measure between 0 and 1 reflecting the opportunity patients have to choose among different providers. It is calculated as one minus the congestion (the ratio between assigned visits to a provider and his/her maximum caseload) a person experiences for each visit at his/her assigned provider. Higher values mean on average, patients living in that geographic area visit providers who have more excess capacity.
Coverage is a measure between 0 and 1 reflecting patients’ ability to find providers to serve them. Specifically, it equals the proportion of adults in a geographic area who were matched with a provider.
Also included in the file is the estimated number of visits needed and the estimated number of visits served. The number of visits needed depends on the age, gender, and insurance status of the population. The number of visits served is the number of visits needed that providers are able to see, which is based on the estimated supply of providers. The difference between needed and served visits is the unmet need for the population residing in that geographic area.
These estimates can be used to identify locations where to target improvements in spatial access to adult primary care and to quantify disparities between Medicaid-insured v. non Medicaid-insured adult population.
The data file attached with this descriptor includes the following columns:
GEOID10 - The identification number of the census tract
X & Y - latitude and longitude
Accessibility: Accessibility for the overall population living in that census tract
AccessibilityMED: Accessibility for the Medicaid-insured population living in that census tract
Availability: Availability for the overall population living in that census tract
AvailabilityMED: Availability for the Medicaid-insured population living in that census tract
Coverage: Coverage for the overall population living in that census tract
CoverageMED: Coverage for the Medicaid-insured population living in that census tract
VisitsNeeded: The number of visits needed by the overall population living in that census tract
VisitsServed: The number of visits needed by the overall population living in that census tract that are able to be served by the available supply
VisitsNeededMED: The number of visits needed by the Medicaid-insured population living in that census tract
VisitsServedMED: The number of visits needed by the Medicaid-insured population living in that census tract that are able to be served by the available supply
Taxonomy
- Estimates
- Access
References
Harati, P., Gentili, M., Serban, N. (2015) "Projecting the Impact of the Affordable Care Act Provisions on Accessibility and Availability of Primary Care for the Adult Population in Georgia", under review.
Data Descriptor
Data descriptor citation:
Gentili, M., Serban, N., Swann, J. "Accessibility and Availability of Pediatric Primary Care: California", published by the Health Analytics Group@GT.
This data descriptor presents small-area estimates for spatial access estimates derived using optimization modeling with access constraints, for the state of California and for year 2013. Estimates are included for both the overall children population (that is, Medicaid-insured, privately-insured and uninsured populations combined) and for the Medicaid-insured population alone. Spatial access measures considered are Accessibility and Availability.
Accessibility pertains to the distance barriers that patients experience in reaching their providers, measured as travel distance. Availability pertains to the providers’ patient volume or time available for healthcare delivery that patients experience when seeking care, measured as congestion experienced at in the provider's office.We also provide the percentage of children who have access, defined here as coverage. The estimates are differentiated for public-insured and private-insured children because of the differences in acceptability of these two insurance types. These estimates can be used to identify locations where to target improvements in spatial access to pediatric primary care and to quantify disparities between public-insured and private-insured children. Similar estimates are also provided for other states available as separate data descriptors, allowing for comparisons between states.
The data file attached with this descriptor includes the following columns:
GEOID10 - The identification number of the census tract
X & Y - latitude and longitude
Coverage - The percentage of children who are matched with a provider (i.e. they have access)
CoverageMED - The percentage of public-insured children who are matched with a provider accepting public insurance
CoveragOTH - The percentage of private-insured children who are matched with a provider
TravelDistance - The average travel distance a child travels to reach his/her primary care provider
TravelDistanceMED - The average travel distance a public-insured child travels to reach his/her primary care provider accepting public insurance
TravelDistanceOTH - The average travel distance a privately-insured child travels to reach his/her primary care provider
Congestion - The ratio between met need to providers' caseload
CongestionMED - The ratio between met need for public-insured children to providers' Medicaid caseload
CongestionOTH - The ratio between met need for privately-insured children to providers' non-Medicaid caseload
Taxonomy
- Estimates
- Access
References
Gentili, M., Isett, K., Serban, N., Swann, J. (2015) "Small-Area Estimation of Spatial Access to Pediatric Primary Care and Its Implications for Policy", Journal of Urban Health, 92(5):864-909.
Gentili, M., Serban, N., O'Connor, J., Swann, J. (2015+) "Quantifying Disparities in Accessibility and Availability of Pediatric Primary Care with Implications for Policy", under revisions.